Bicycle Dashboard
Keith Rineaman has been keeping a Tinderbox cycling dashboard since September 2008. He describes the some high points:
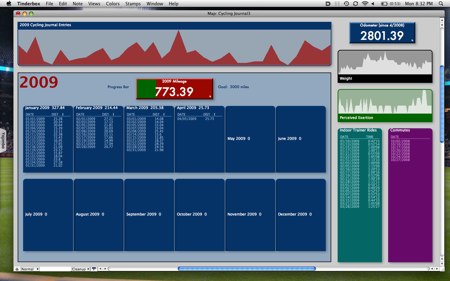
- The "2009 Cycling Journal Entries" container holds notes for each ride and plots the miles so I can visualize how my rides are trending. I have attributes set up for date, ride duration, miles, avg speed, annual mileage, odometer, weight, perceived exertion, and boolean attributes for indoor rides and commutes. I keep notes on the ride (route, weather, how I felt, etc.).
- The progress bar tracks annual mileage and progress toward my goal of 3,000 miles for 2009. One of the things I'm thinking about for the progress bar is to change color if I'm on track or not, since I need to average approx 60 miles a week to hit 3,000. At the moment I'm a little behind, which I'd expect in early Spring. I have a graph in iWork Numbers, but it would be cool to see it in my dashboard.
- Agents collect and display ride data (inside the "2009" adornment) for each month along with total mileage for the month. This allows me to see all my rides by month and track progress. For example, in January I added the total mileage for each month in the display name because I did a 300 mile challenge and wanted to see how I was doing.
- The odometer in the upper right tracks total miles since April 2008.
- Two graphs on the right plot my weight and perceived exertion (1 to 5) for each ride. This gives me additional insight on how my workouts are trending. These graphs pull from all rides (2008 and 2009) because I want to see a wider range of data.
- Other Agents track indoor rides (on the bike trainer) and commutes.
- Not shown is an adornment with 2008 data and a notes container where I track bike maintenance and whatever else I need to remember.
