XY Plots
Tinderbox dashboards have offered histograms for a while. The new Tinderbox 5.9, which will likely be available in a few hours, adds xyplots, too.
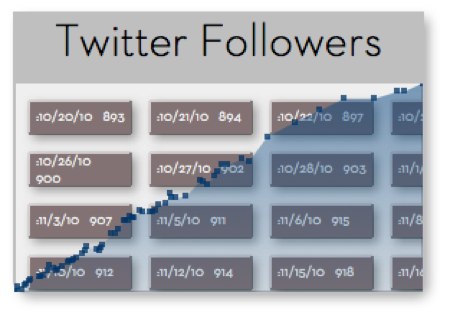
Histograms could substitute in charts like this if each entry were evenly spaces – if you checked your Twitter followers every day, for example. The new plot lets you specify both X and Y coordinates for each item. Any container or agent can have its own graph in seconds.